The association of metformin dose up-titration and treatment duration with adiposity, lipid profile indicators, and serum leptin levels in T2DM Iraqi patients
DOI:
https://doi.org/10.17532/jhsci.2023.1845Keywords:
Hemoglobin A1C, insulin level, lipid profile, metformin dose, type 2 diabetes mellitus, visceral adiposityAbstract
Introduction: Numerous factors, including age, gender, physical inactivity, insufficient dose, noncompliance, and drug-drug interactions, may contribute to significant intraindividual variation in metformin (MET) response. This study aims to determine the effect of Met dose and treatment duration on adiposity markers and serum leptin levels in Iraqi patients with type 2 diabetes.
Methods: Between October 2021 and March 2022, a cross-sectional study at the Diabetes and Endocrinology Center in Baghdad included 150 type 2 diabetes mellitus (T2DM) patients with a disease duration of more than 1 year. Clinical and physical examinations were conducted before enrollment. We measured anthropometric variables such as body mass index, waist-to-hip ratio, and visceral adiposity index. We evaluated glycated hemoglobin, leptin, C-reactive protein, total cholesterol (TC), high-density lipoprotein cholesterol (HDL-c), and triglycerides (TGs) in the serum.
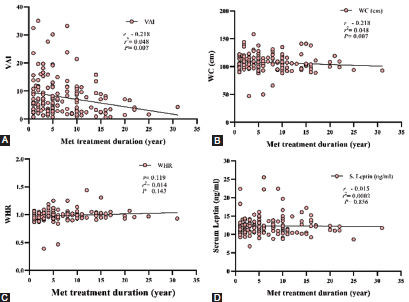
Results: Only the TC/HDL-c and TG/HDL-c ratios were significantly different after the data were arranged according to glycemic control level. Arrangement for MET doses and treatment duration, none of the evaluated parameters were significantly different (p > 0.05) between groups receiving different doses of MET for different durations, except visceral adiposity index (VAI), which shows a very slight decrease (p = 0.046) after more than 10 years of treatment. Pearson’s correlation analysis revealed a weak and significant association between waist circumference (WC) and hip circumference and MET doses, and a weak and significant association between WC, VAI, and TG levels and treatment duration. The other markers lacked a significant relationship with MET doses or duration of treatment.
Conclusion: MET dose and duration of treatment were not significantly correlated with adiposity and lipid profiles in Iraqi patients with T2DM.
Downloads
Downloads
Published
Issue
Section
Categories
License
Copyright (c) 2023 Zainab S. Abdulrahman, Mohammed Qasim Alatrakji, Ahmed Abood Al-Maliky, Khalid Ibrahim Hussein, Saad Abdulrahman Hussain

This work is licensed under a Creative Commons Attribution 4.0 International License.
How to Cite